IR BLOG
January-September 2025 results - Q&A
Sampo Group continued its solid financial performance in January-September 2025, driven by positive momentum across private and SME lines, and strong underwriting performance in a favourable claims environment.
The underwriting result grew by 17 per cent on a currency adjusted basis to 1,121 million (955) in January-September, fuelled by robust top-line growth and strong margins. In the third quarter, the underwriting result increased by 5 per cent to EUR 392 (374).
Earnings per share amounted to EUR 0.54 (0.39), supported by EUR 355 million net gain on NOBA following its successful IPO in September. Operating EPS increased by 14 per cent to EUR 0.38 (0.34), driven by a higher underwriting result. In the third quarter, EPS amounted to EUR 0.28 (0.13) and operating EPS to EUR 0.14 (0.12).
Meanwhile, the Group combined ratio improved to 83.4 per cent (84.6) in January-September 2025 and stood at 83.0 (82.5) in the third quarter, keeping performance well aligned with the financial targets.
Given the sustained strong financial performance and our confidence and ambition heading into 2026, we have increased our operating EPS target for the 2024-2026 strategic period to more than 9 per cent from over 7 per cent set in 2024. At the same time, the outlook for 2025 remains unchanged given with the half-year 2025 results.
For 2025 we continue to expect to deliver insurance revenue of EUR 8.9-9.1 billion, representing 6–9% growth, and an underwriting result of EUR 1,425-1,525 million, implying an increase of 8–16% per cent.
| Key figures, EURm | 7-9/2025 | 7-9/2024 | Change, % | 1-9/2025 |
1-9/2024 |
Change, % |
|---|---|---|---|---|---|---|
| Gross written premiums | 2,218 | 2,088 | 6 | 8,461 | 7,718 | 10 |
| Insurance revenue, net | 2,303 | 2,137 | 8 | 6,755 | 6,214 | 9 |
| Underwriting result | 392 | 374 | 5 | 1,121 | 955 | 17 |
| Net financial result | 549 | 128 | 328 | 836 | 573 | 46 |
| Profit before taxes | 866 | 432 | 101 | 1,769 | 1,340 | 32 |
| Net profit | 757 | 320 | 136 | 1,460 | 973 | 50 |
| Operating result | 366 | 297 | 23 | 1,031 | 846 | 22 |
| Earnings per share (EUR) | 0.28 | 0.13 | 122 | 0.54 | 0.39 | 40 |
| Operating EPS (EUR) | 0.14 | 0.12 | 16 | 0.38 | 0.34 | 14 |
| Risk ratio, % | 58.1 | 57.5 | 0.6 | 57.9 | 59.5 | -1.6 |
| Cost ratio, % | 24.9 | 25.0 | -0.2 | 25.5 | 25.1 | 0.4 |
| Combined ratio, % | 83.0 | 82.5 | 0.5 | 83.4 | 84.6 | -1.2 |
| Solvency II ratio (incl. dividend accrual), % | - | - | - | 172 | 177 | -5 |
Gross written premiums and insurance revenue include broker revenues. Like-for-like GWP growth is calculated by using constant currency rates and it is adjusted to exclude potential technical items affecting comparability, such as portfolio transfers, changes in inception dates for large contracts, and changes in accounting methods. Net profit for the comparison period refers to Net profit for the equity holders. Per share figures for the comparison period are adjusted for the share split in February 2025. The figures have not been audited.
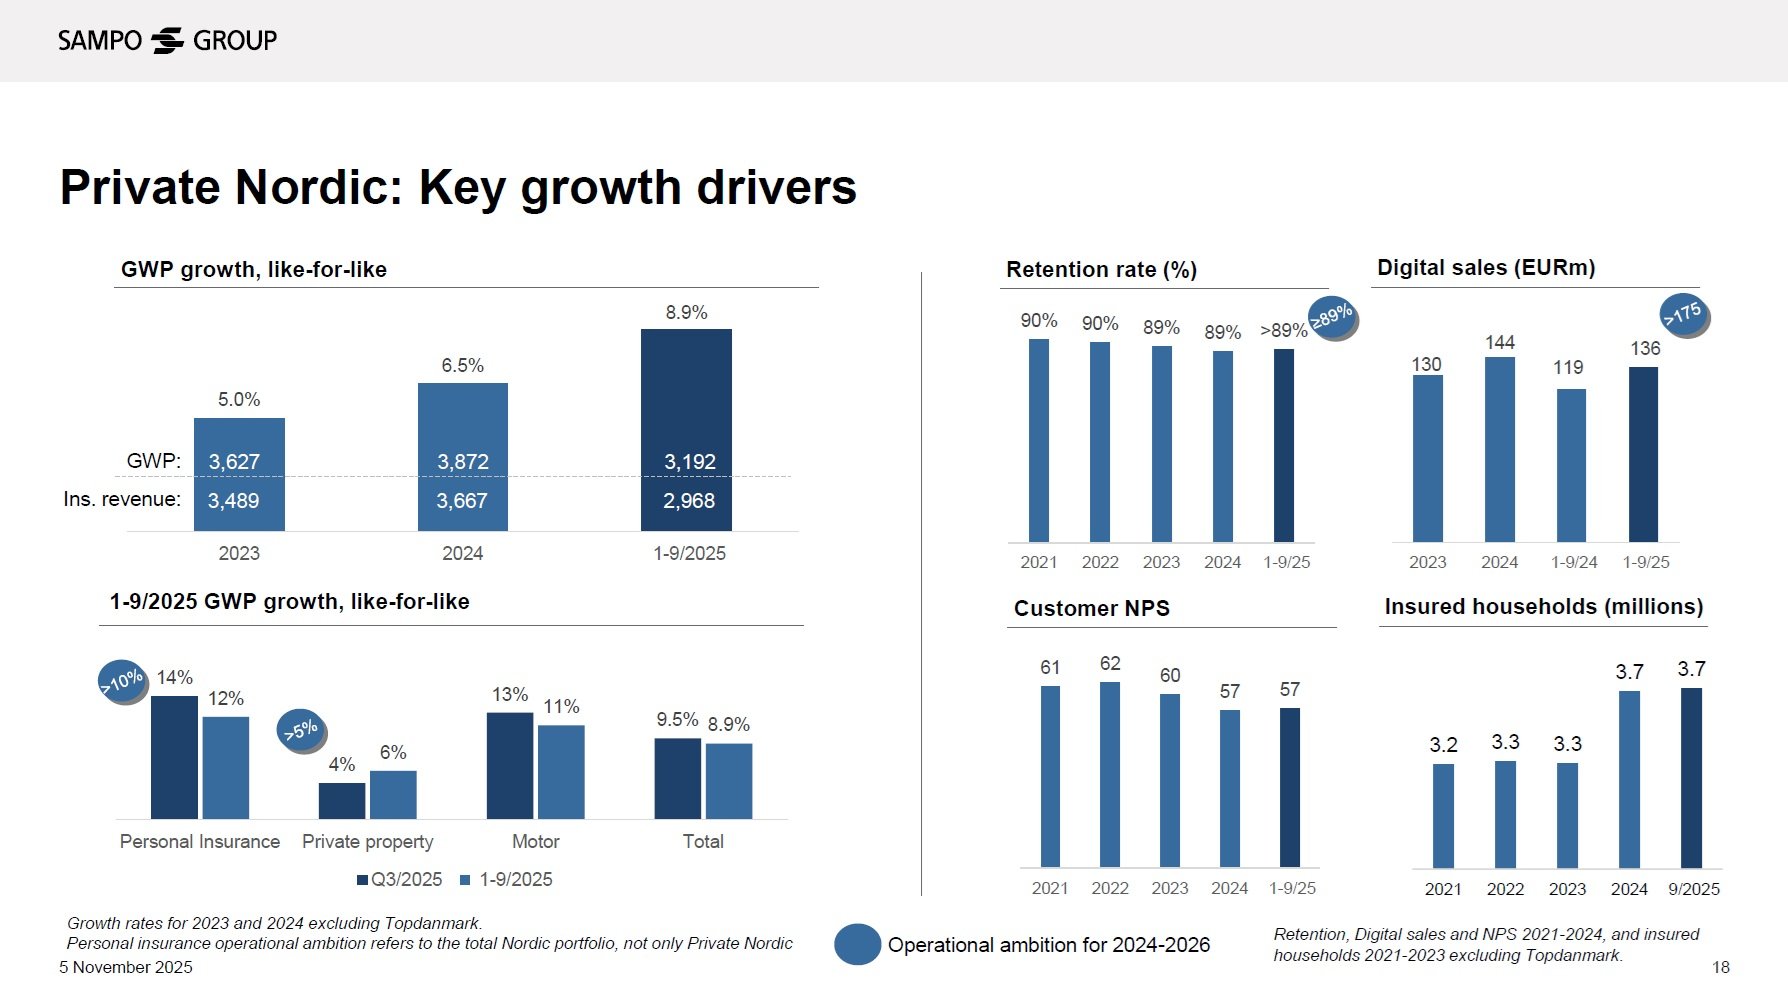
Private Nordic continued to report record strong top-line growth in the third quarter. What were the key drivers behind the 10 per cent like-for-like GWP growth?
In Private Nordic, we saw accelerated high quality growth in the third quarter, driven by high and stable retention, rate actions to mitigate claims inflation, and broad-based growth across countries and product lines.
Norway continued to deliver double-digit growth, supported by rate action and customer inflows, while Finland also stood out with strong growth driven by motor and personal insurance. In terms of product lines, personal insurance premiums were up 14 per cent and motor grew by 13 per cent, driven by continued rebound in new car sales, albeit still from the relatively low levels seen in recent years. Further, momentum in Private Nordic digital sales remained strong.

Why was growth more moderate in Private UK?
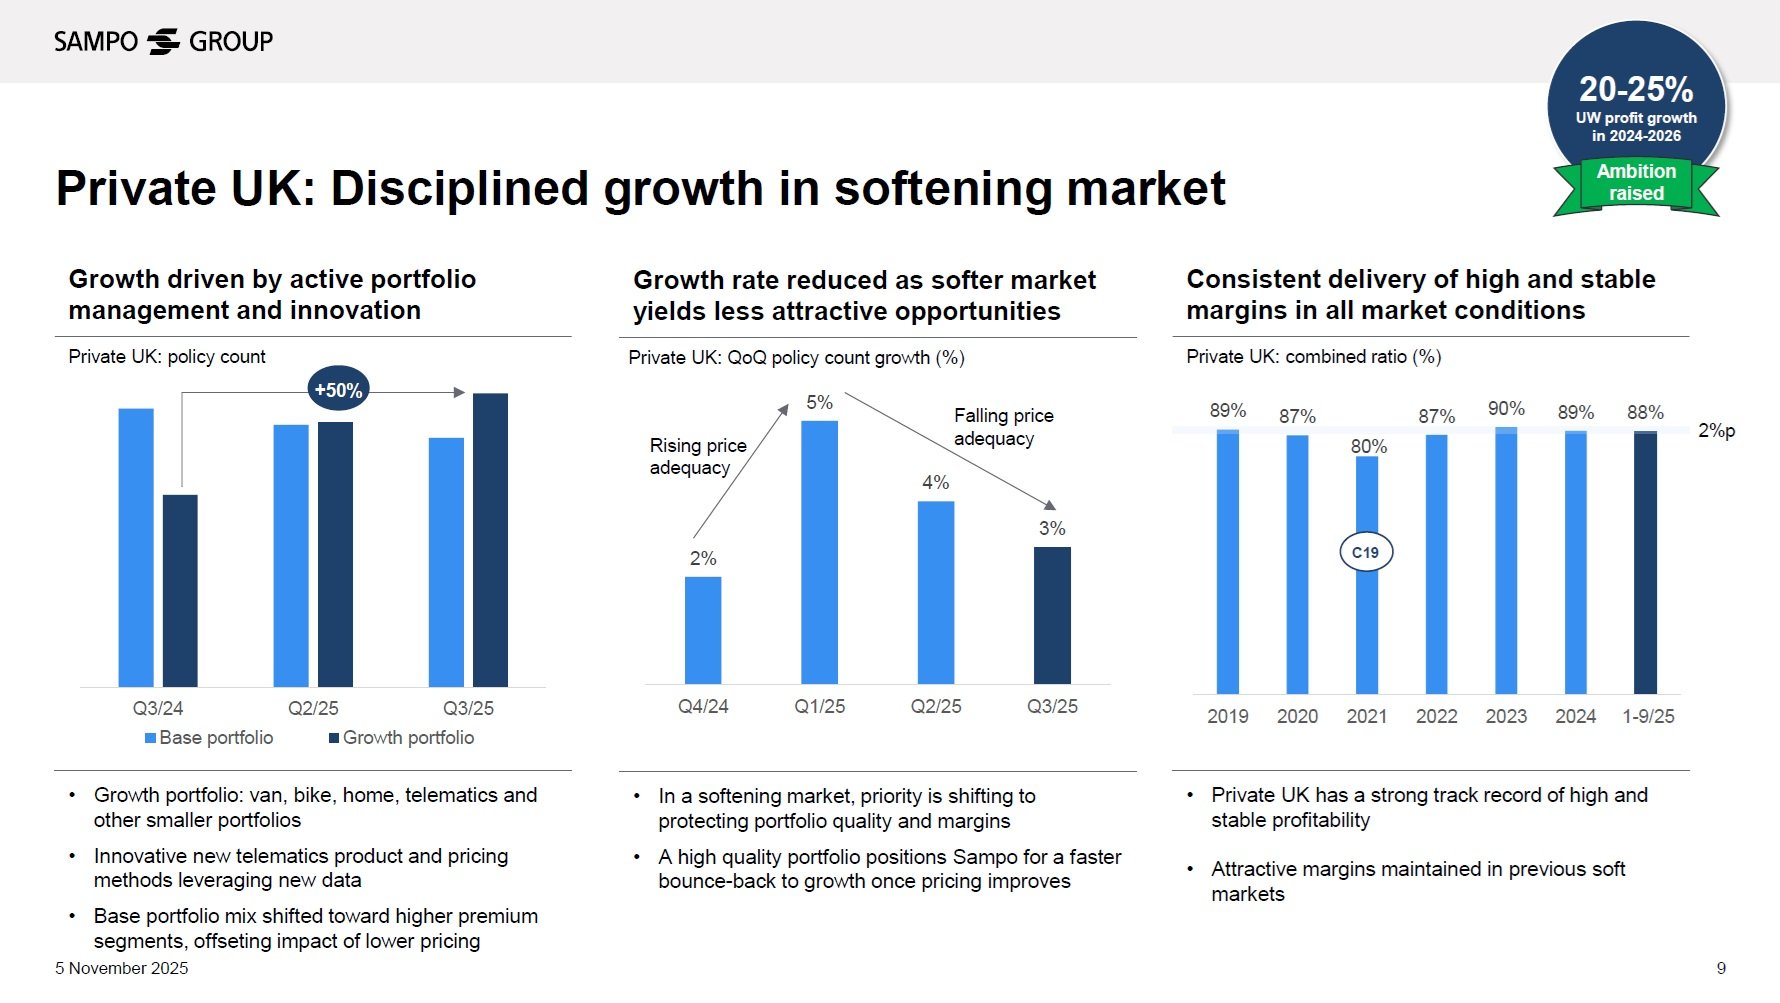
In the UK, like-for-like top-line growth in the third quarter was 7 per cent, driven by continued selective live customer policy (LCP) growth, particularly within the higher premium segment. We have actively managed growth in response to declining market prices, leading to a lower increase in policy count. Softer market pricing has also resulted in lower activity on price comparison websites, which, on the other hand, supported customer retention.
Thanks to our underwriting discipline and prudent approach to reserving, we have been able to deliver our target margins. However, the period of excess margins is over, and our growth appetite is now highly selective. We continue to see long-term growth opportunities in the UK, although the pace of pursuit will always reflect prevailing market conditions. Underwriting discipline remains at the core of our approach.

What were the key highlights of Nordic Commercial and Nordic Industrial?
Nordic Commercial continued to deliver robust growth, following strong performance in key growth areas, such as SME, personal insurance, and digital sales. In the third quarter, like-for-like GWP growth accelerated to 7.8 per cent from 6.3 per cent in the second quarter. SME saw a 7 per cent growth and personal insurance achieved a particularly notable 16 per cent increase in the quarter. Moreover, digital sales increased up 17 per cent, reflecting a continued trend of SMEs following retail customers online.
In Nordic Industrial, like-for-like GWP contracted by 15.2 per cent in the third quarter, mainly driven by lost volume related to a couple of larger property clients in Sweden and Denmark, while top-line development remained positive in both Norway and Finland. At the same time, we delivered excellent margins. As the market environment for large corporates has become more competitive, we remain focused on securing portfolio quality and margin stability. The de-risking actions are now largely completed, but the impact on volumes is expected to continue throughout 2025 and slightly into 2026.
Sampo increased its operating EPS target for the 2024-2026 strategic period to more than 9 per cent. What factors drove that change?
Given the strong financial performance, we want to keep our high ambition and raised the target to more than 9 per cent from more than 7 per cent set in 2024. We had already outperformed the target of over 7 per cent annually on average for 2024-2026 with 13 per cent growth both in 2024 and in the first nine months of 2025, and we continue to have confidence in our strategy and ability to execute on it. However, it is important to note that we still have the winter ahead of us and winter conditions can be unpredictable. Overall, we remain confident in going into 2026.
Are you seeing potential to increase the Topdanmark synergy estimate, since realisation has been ahead of schedule?
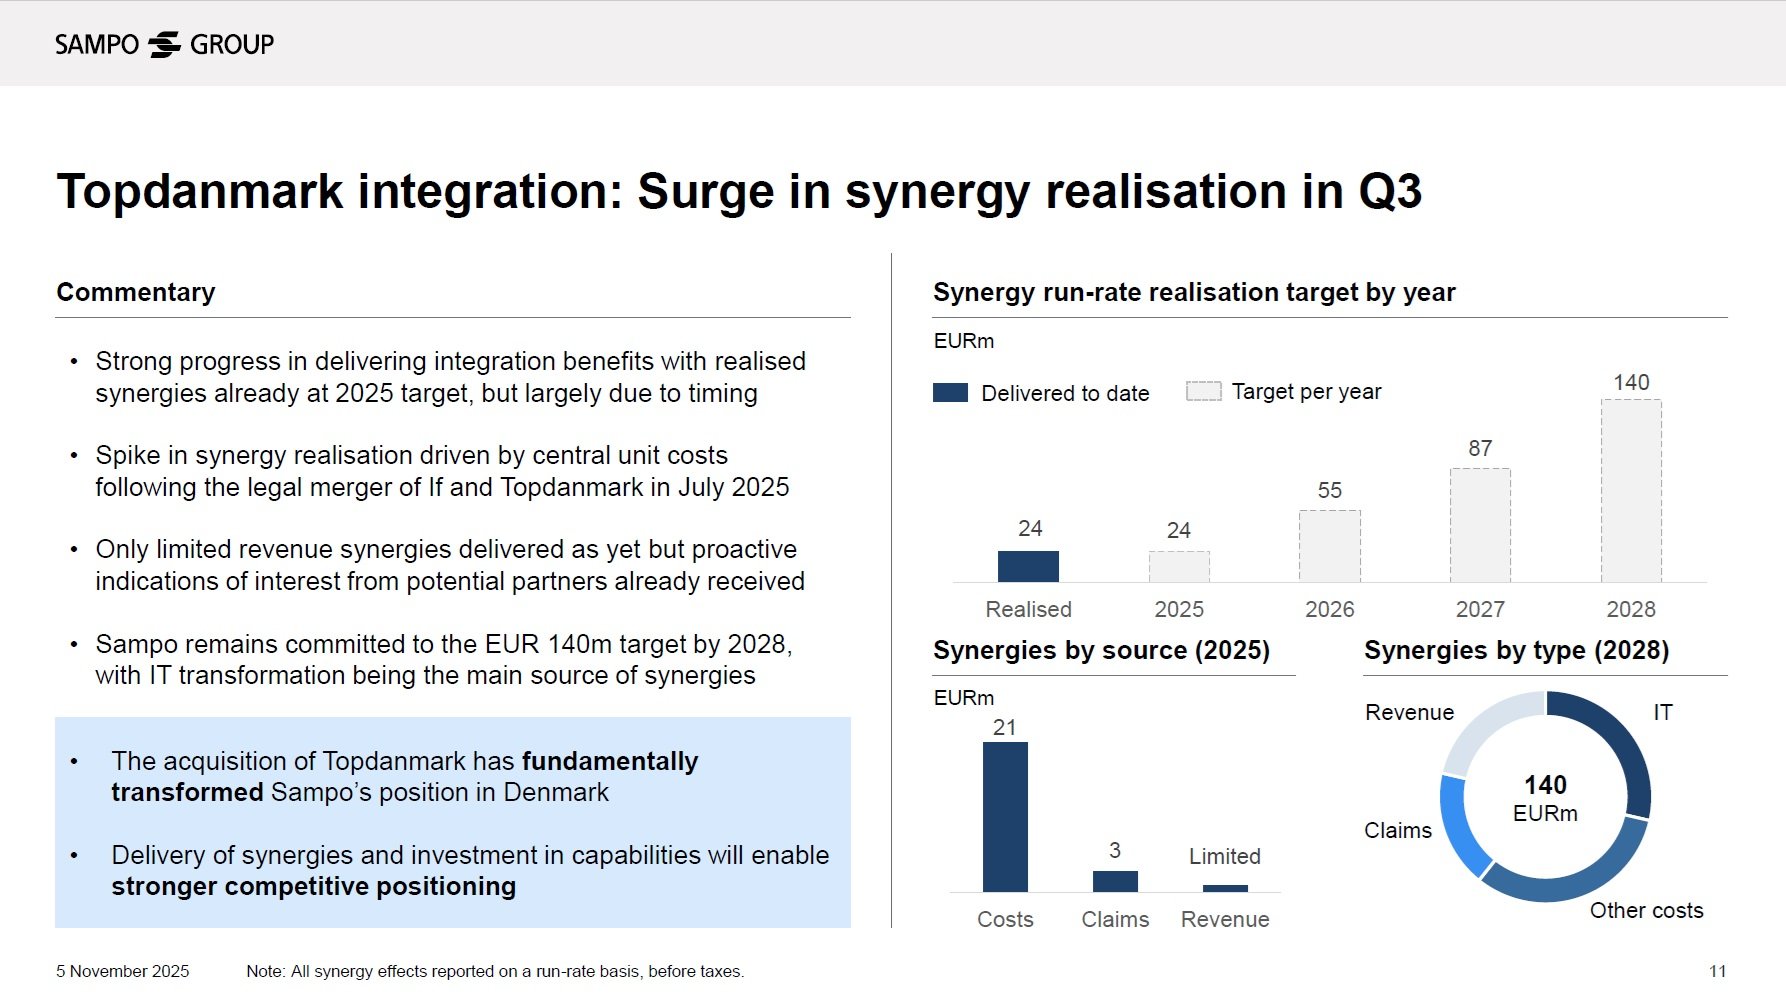
The integration is progressing well. At the end of second quarter, we had realised EUR 11 million and in the third quarter another EUR 13 million, putting us in the situation where we are already at the full year target for 2025. We assess that the difference being ahead of schedule is largely down to timing and remain committed to the EUR 140 million target for 2028, albeit with increased confidence. We recommend looking at our Analyst Day 2025 materials for a detailed presentation of the roadmap to the Topdanmark synergies.

When will you sell more NOBA shares?
We just reduced our holding in NOBA from 20 per cent to 15 per cent in connection with its IPO in late September, generating around EUR 150 million in proceeds for Sampo. We are now subject to a 180-day lock-up period, ending in late March 2026. It is worth noting that a full exit from NOBA will likely require more than one transaction. At the same time, we are pleased with NOBA’s share price development following the IPO.
