
IR BLOG
January–September 2026 results – Q&A
Sampo Group continued to deliver solid financial results in July-September 2026, underpinned by positive momentum across all segments. Strong like-for-like top-line growth of 6 per cent, combined with excellent underwriting margins, drove a 9 per cent increase in the underwriting result on a currency-adjusted basis.
The Group’s top-line development continued to be supported by durable and broad-based growth with continued progress in our largest segments. Private Nordic maintained strong demand-driven momentum in personal insurance, its fastest-growing product line, which grew by 12 per cent in the quarter. In the UK, solid volume growth in carefully targeted segments led to a further increase in live customer policies, up 13 per cent. In Nordic Commercial, the improvement in activity seen in the second quarter carried over into the third, driven by strong performance in SME where like-for-like GWP grew by 9 per cent.
As a result, GWP, including brokerage income, grew by 6 per cent on a like-for-like basis, while reported GWP increased up 7 per cent. Importantly, growth was accompanied by a 9 per cent increase in underwriting profit on a currency adjusted basis and 11 per cent increase on a reported basis to EUR 435 million (392), underlining the quality of the top-line development. At the same time, the combined ratio remained at an excellent level of 82.6 per cent (83.0), improving by 0.3 percentage points from the prior year period.
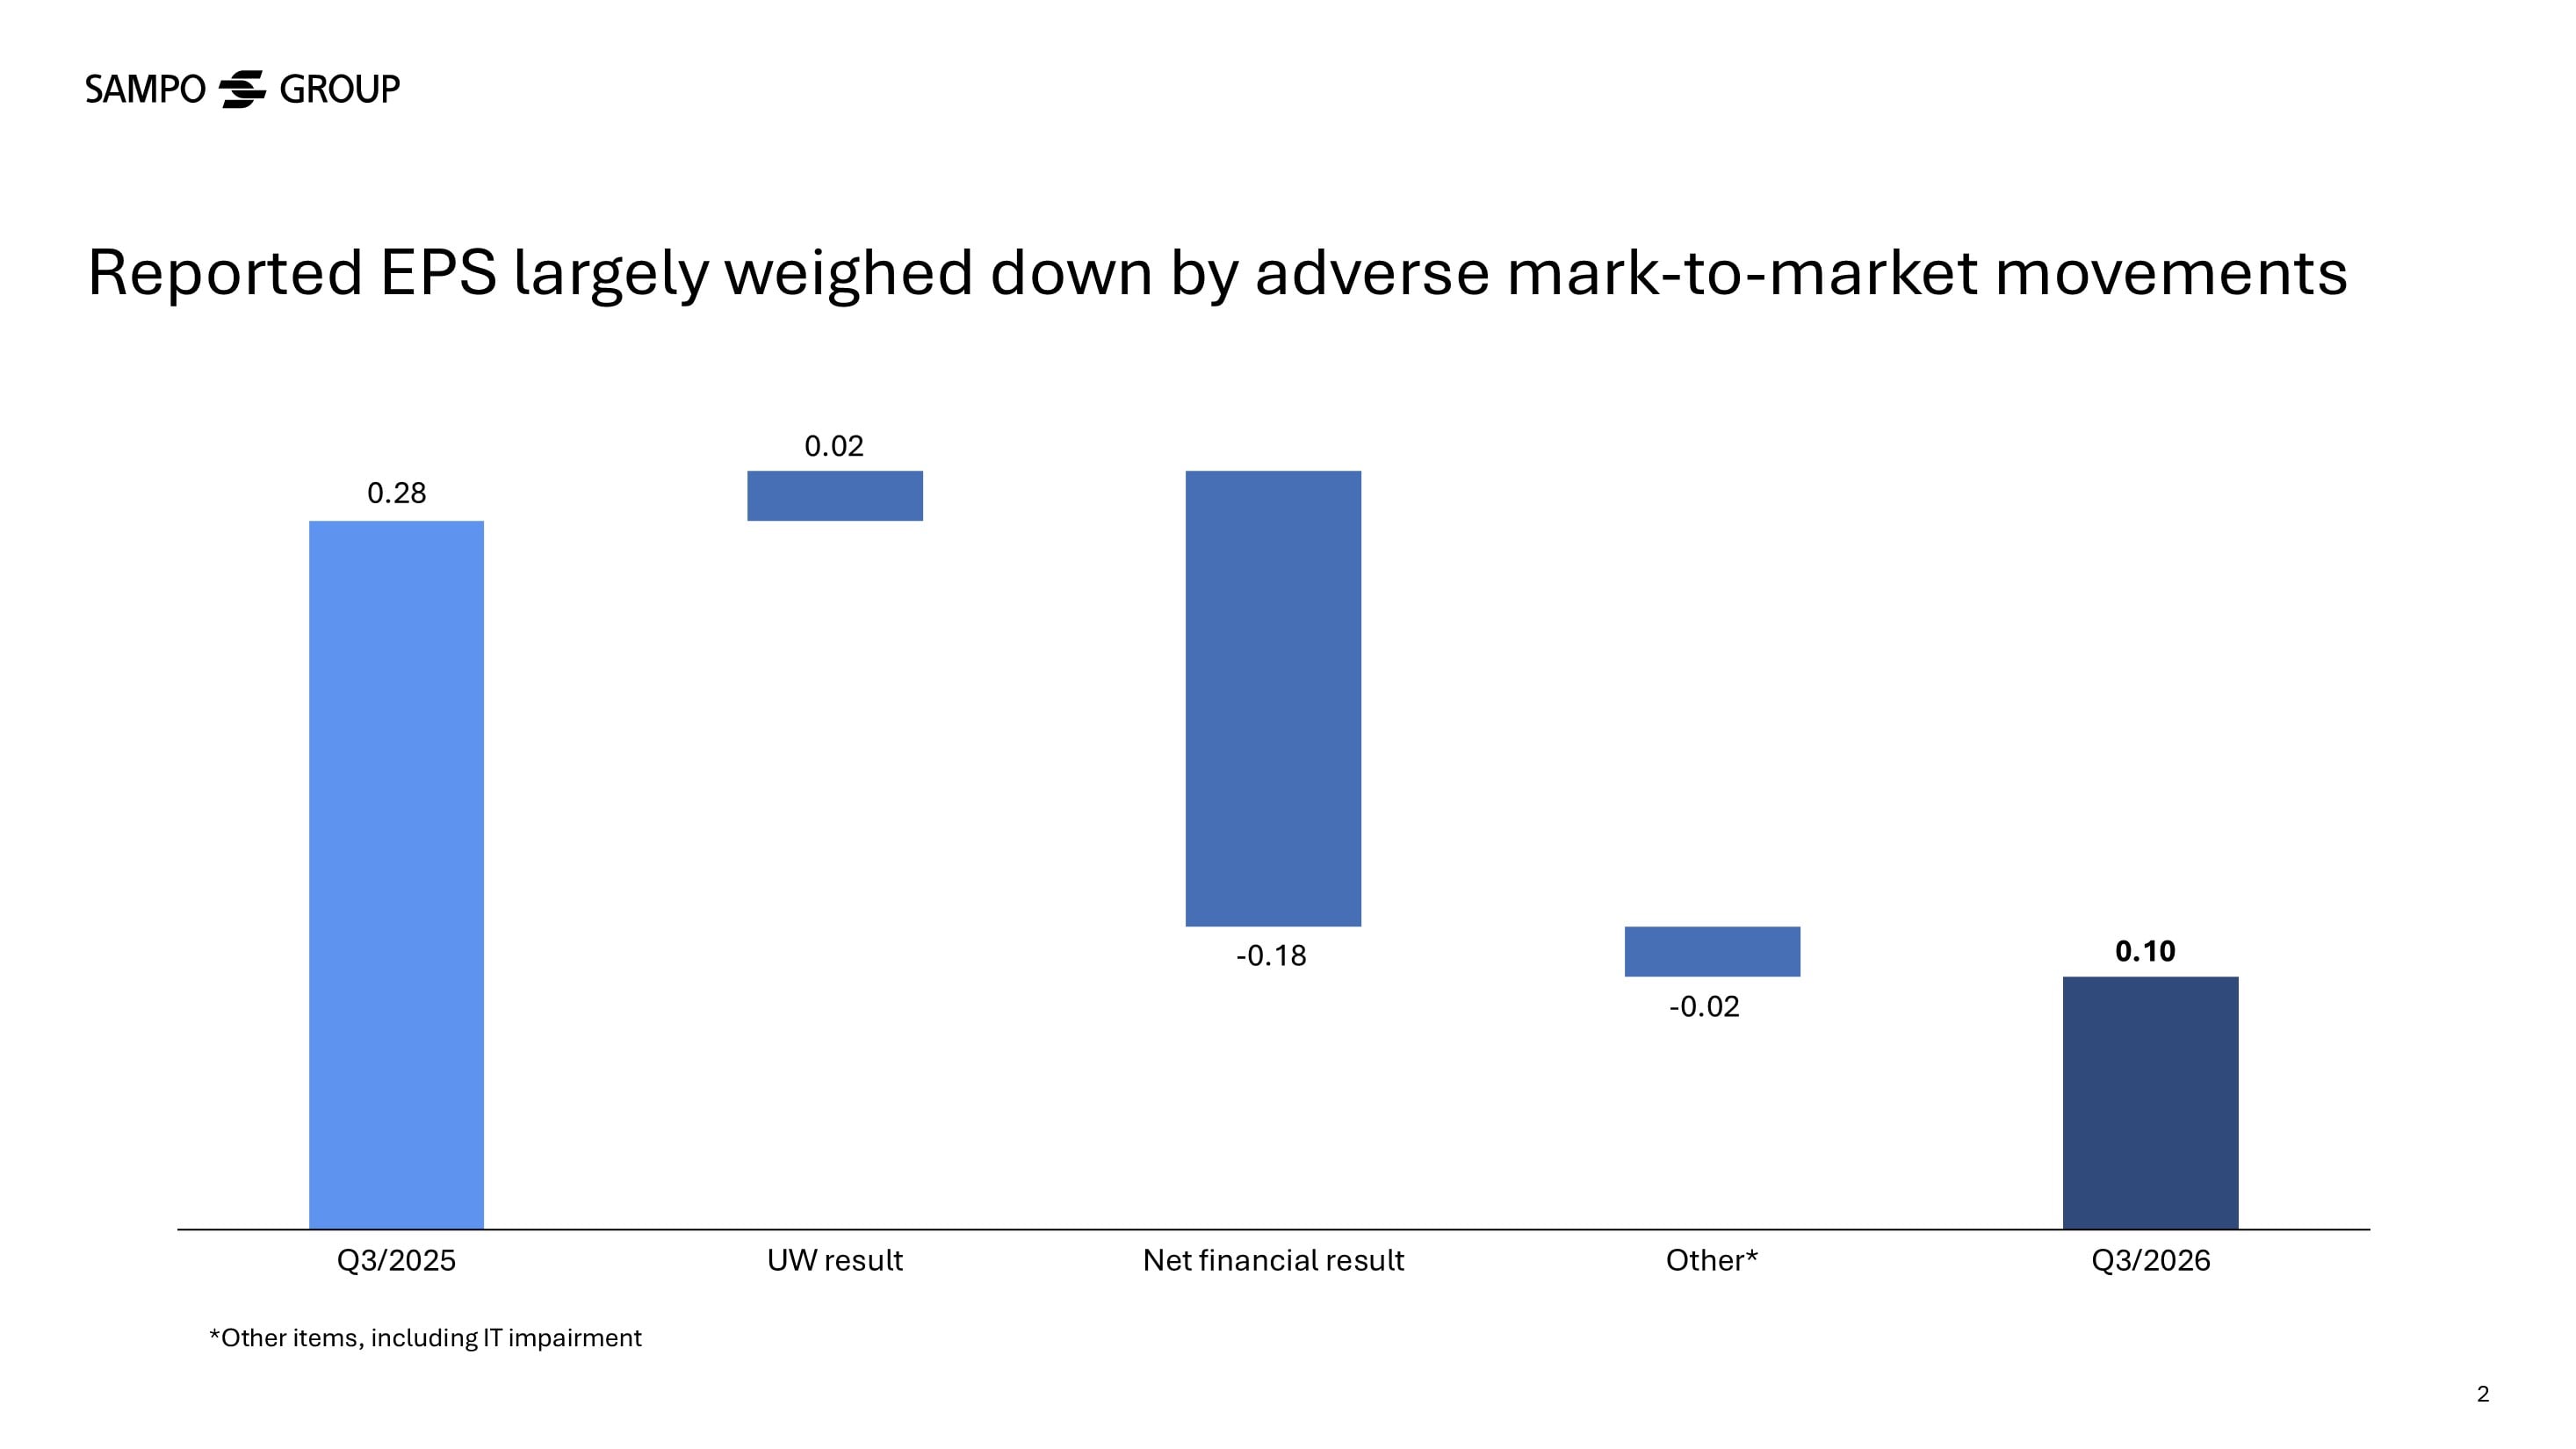
Driven by the higher underwriting result, the operating EPS strengthened by 2 per cent to EUR 0.14 (0.14), largely offset by realised gains being lower than in the comparison period. Reported EPS came in at EUR 0.10 (0.28), weighed down by adverse short-term mark-to market movements in the investment portfolio and the IT impairment loss in Denmark. Neither of these had an impact on cash flow. In addition, the comparison figure was materially supported by a net gain of EUR 355 million from the IPO of NOBA in September 2025.
Following the robust operational performance and a favourable claims environment both in terms of severe weather and large claims, we have adjusted our outlook for 2026 as follows.
- Group insurance revenue: EUR 9.75–9.85 billion (from EUR 9.70–9.85 billion), representing growth of 7–9 per cent year-on-year.
- Group underwriting result: EUR 1,600–1,650 million (from EUR 1,550–1,625 million), representing growth of 8–11 per cent year-on-year.
| Key figures, EURm | 7-9/2026 | 7-9/2025 | Change, % | 1-9/2026 |
1-9/2025 |
Change, % |
|---|---|---|---|---|---|---|
| Gross written premiums | 2,373 | 2,218 | 7 | 8,803 | 8,461 | 4 |
| Insurance revenue, net | 2,503 | 2,303 | 9 | 7,303 | 6,755 | 8 |
| Underwriting result | 435 | 392 | 11 | 1,221 | 1,121 | 9 |
| Net financial result | 69 | 549 | -87 | 14 | 836 | -98 |
| Profit before taxes | 323 | 866 | -63 | 934 | 1,769 | -47 |
| Net profit | 270 | 757 | -64 | 687 | 1,460 | -53 |
| Operating result | 365 | 366 | – | 1,096 | 1,031 | 6 |
| Earnings per share (EUR) | 0.10 | 0.28 | -64 | 0.26 | 0.54 | -52 |
| Operating EPS (EUR) | 0.14 | 0.14 | 2 | 0.41 | 0.38 | 8 |
| 7-9/2026 | 7-9/2025 | Change | 1-9/2026 |
1-9/2025 |
Change |
|
| Risk ratio, % | 57.7 | 58.1 | -0.4 | 58.2 | 57.9 | 0.3 |
| Cost ratio, % | 24.9 | 24.9 | 0.1 | 25.0 | 25.5 | -0.4 |
| Combined ratio, % | 82.6 | 83.0 | -0.3 | 83.3 | 83.4 | -0.1 |
| Solvency II ratio (incl. dividend accrual), % | – | – | – | 175 | 172 | 3 |
Gross written premiums (GWP) and insurance revenue include broker revenues. Like-for-like GWP growth is calculated by using constant currency rates and it is adjusted to exclude potential technical items affecting comparability, such as portfolio transfers, changes in inception dates for large contracts, and changes in accounting methods. The figures in this report have not been audited.
Private Nordic reported another quarter of solid growth with 6 per cent increase in top-line. What were the key highlights for the segment?
Private Nordic continued to deliver high-quality growth supported by broad-based performance in all Nordic markets and positive development in key growth areas. Personal insurance remained the strongest growth driver with double-digit GWP growth, supported by sustained demand for complementary health insurance and growing customer interest in personal protection.
Digital sales increased by 8 per cent over the quarter, growing well beyond our operational ambition of more than EUR 175 million digital sales by 2026, which we already reached in 2025. We have also reached our Nordic operational ambition of having more than 70 per cent of claims reported digitally by the end of 2026.
In the third quarter, we saw an 11 per cent rebound in new car sales in Sweden, which is our largest market for mobility. However, this did not translate into meaningful tailwind during the period, mainly reflecting a lag between car sales and insurance premiums, as well as the mix of new car sales. While it remains to be seen how new car sales will develop going forward, a sustained recovery would support our growth given our market-leading position. In total, private motor insurance recorded 3 per cent growth in the third quarter.

How did Private UK develop during the quarter?
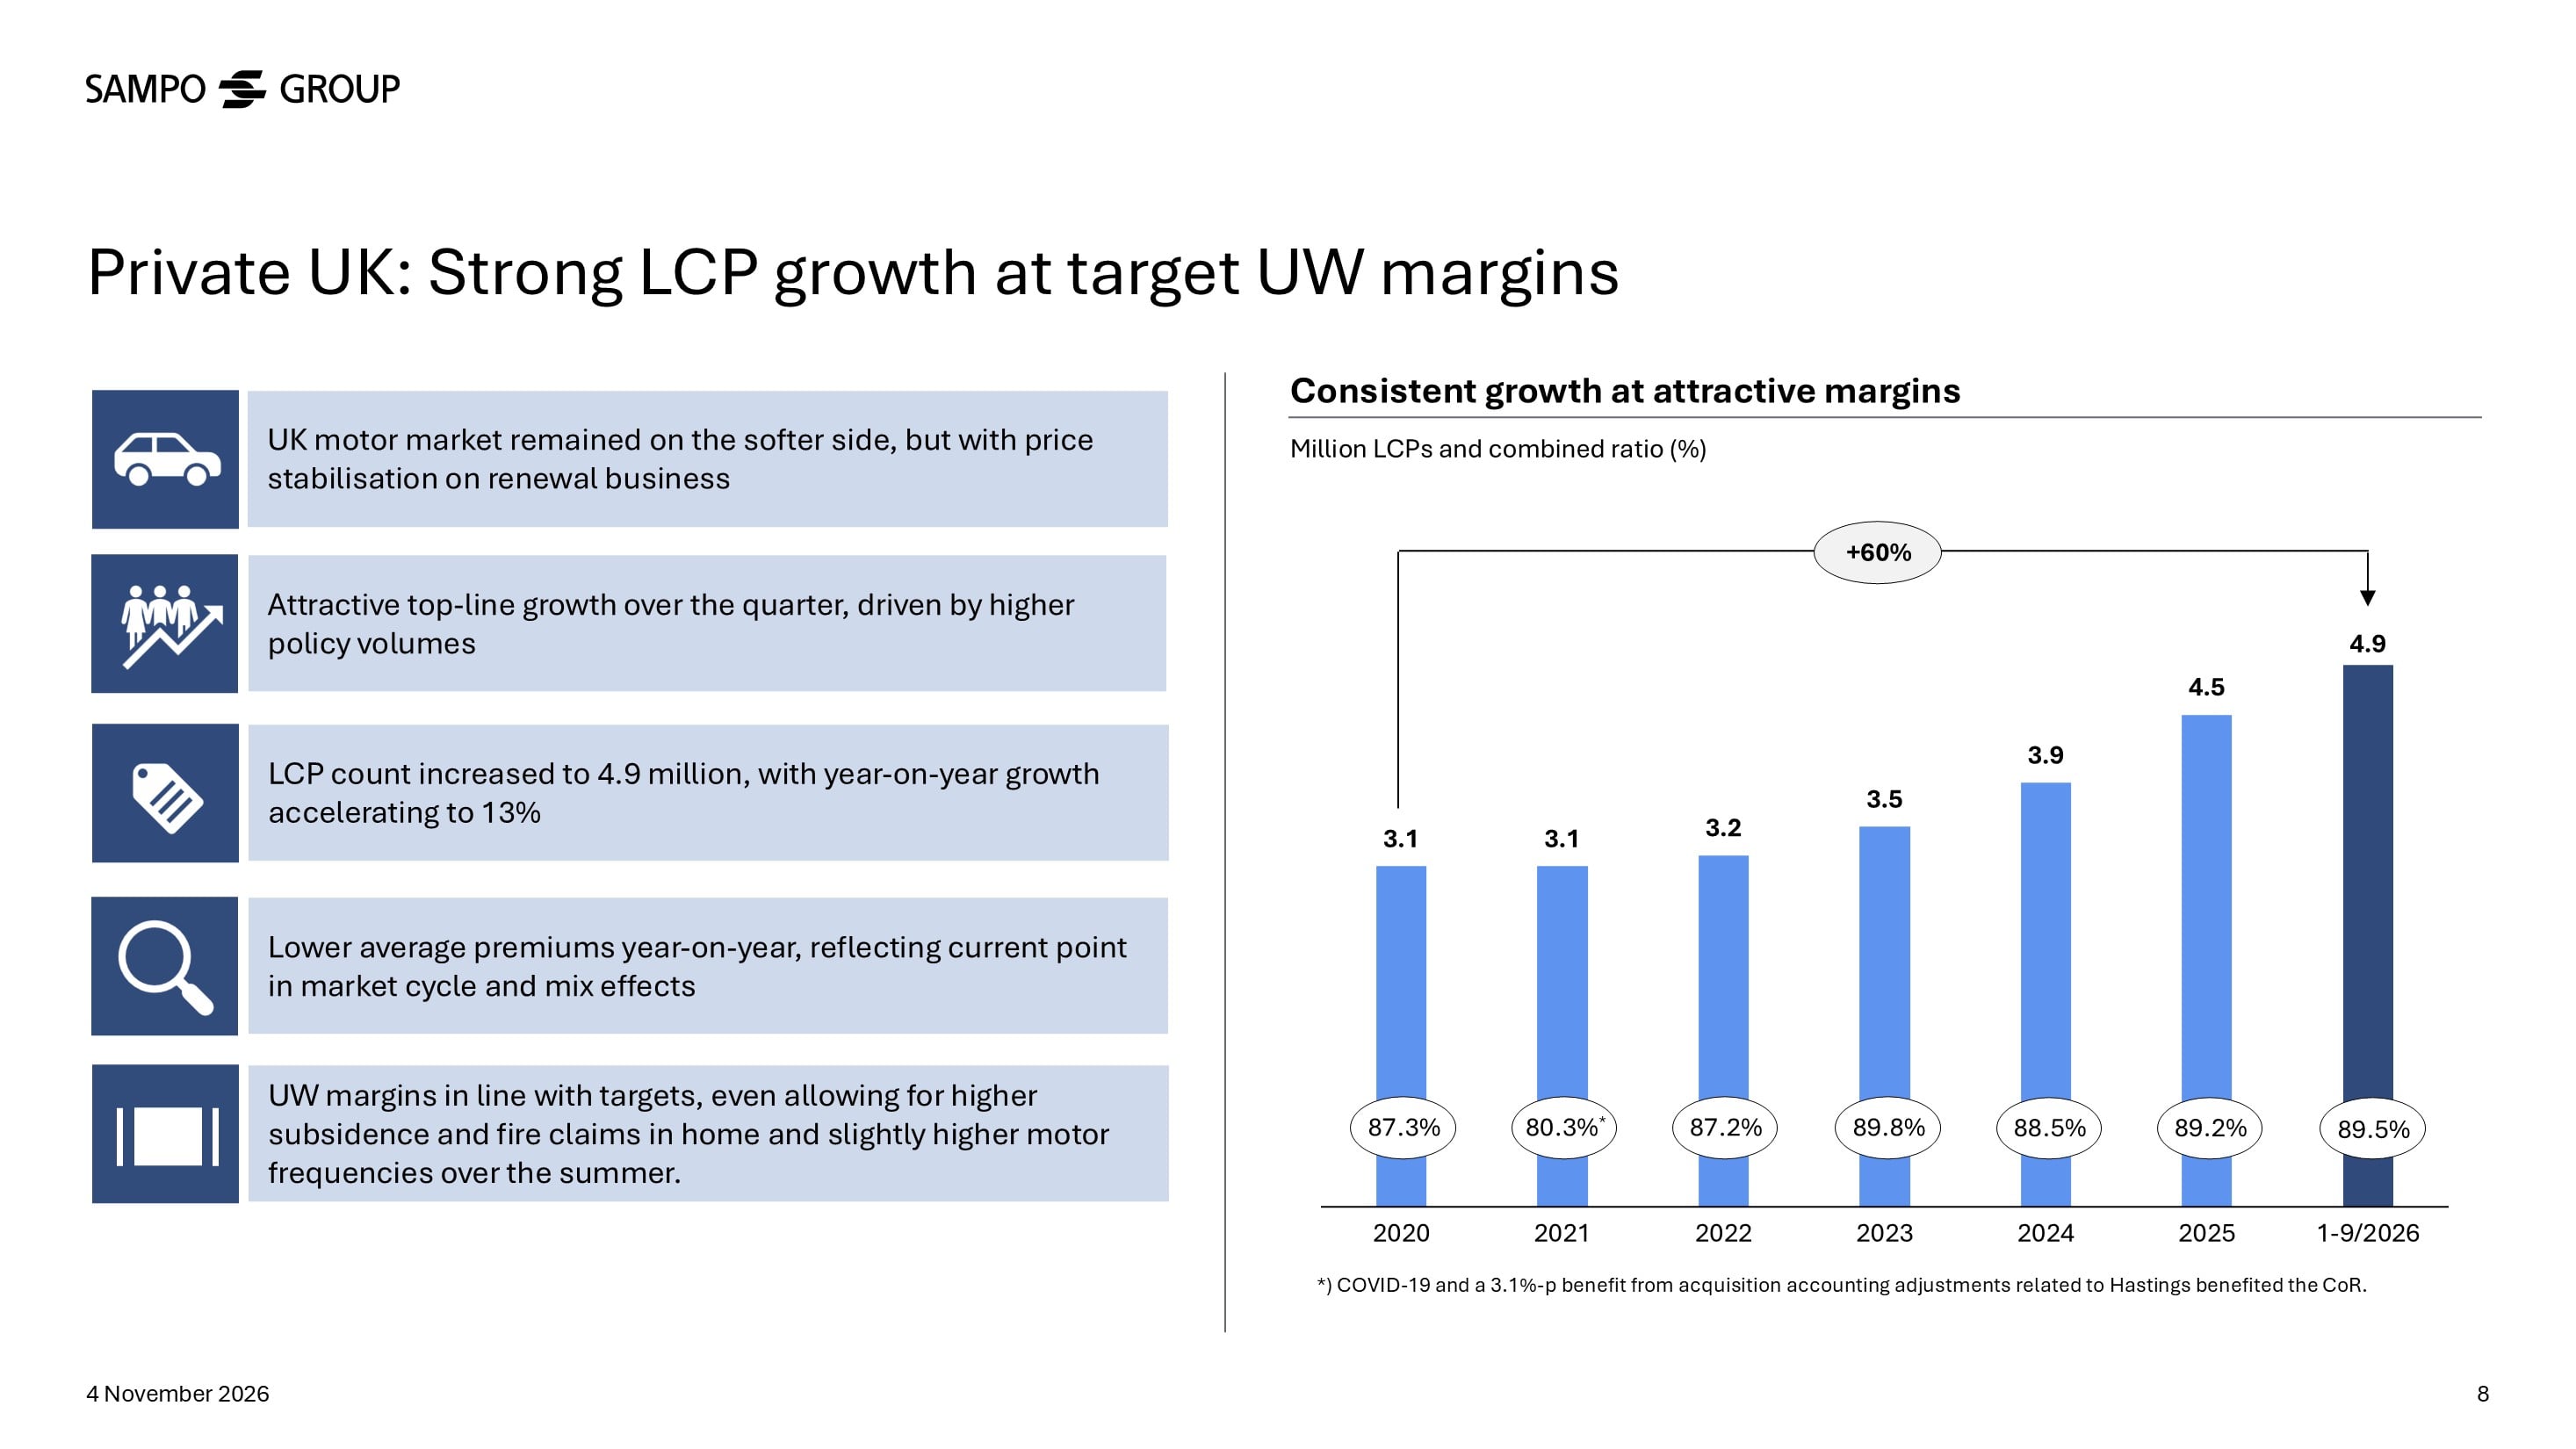
In the UK, we delivered double-digit live customer policy growth year-on-year and are closing in on 5 million customer policies, with around 4 million motor policies and 1 million home policies. In total, the segment delivered like-for-like top-line growth of 7 per cent.
While the UK motor market remained on the softer side with signs of price stabilisation on renewal business, our underwriting margins remained in line with our target range of 88–90 per cent for combined ratio, despite also being affected by increase in subsidence and fire claims in home insurance due to a dry and hot summer.
Our ability to deliver consistently strong underwriting margins across different market conditions is the result of disciplined underwriting, active growth management, and a clear focus on long-term value creation over short-term gains.
What are the highlights for Nordic Commercial and Nordic Industrial?
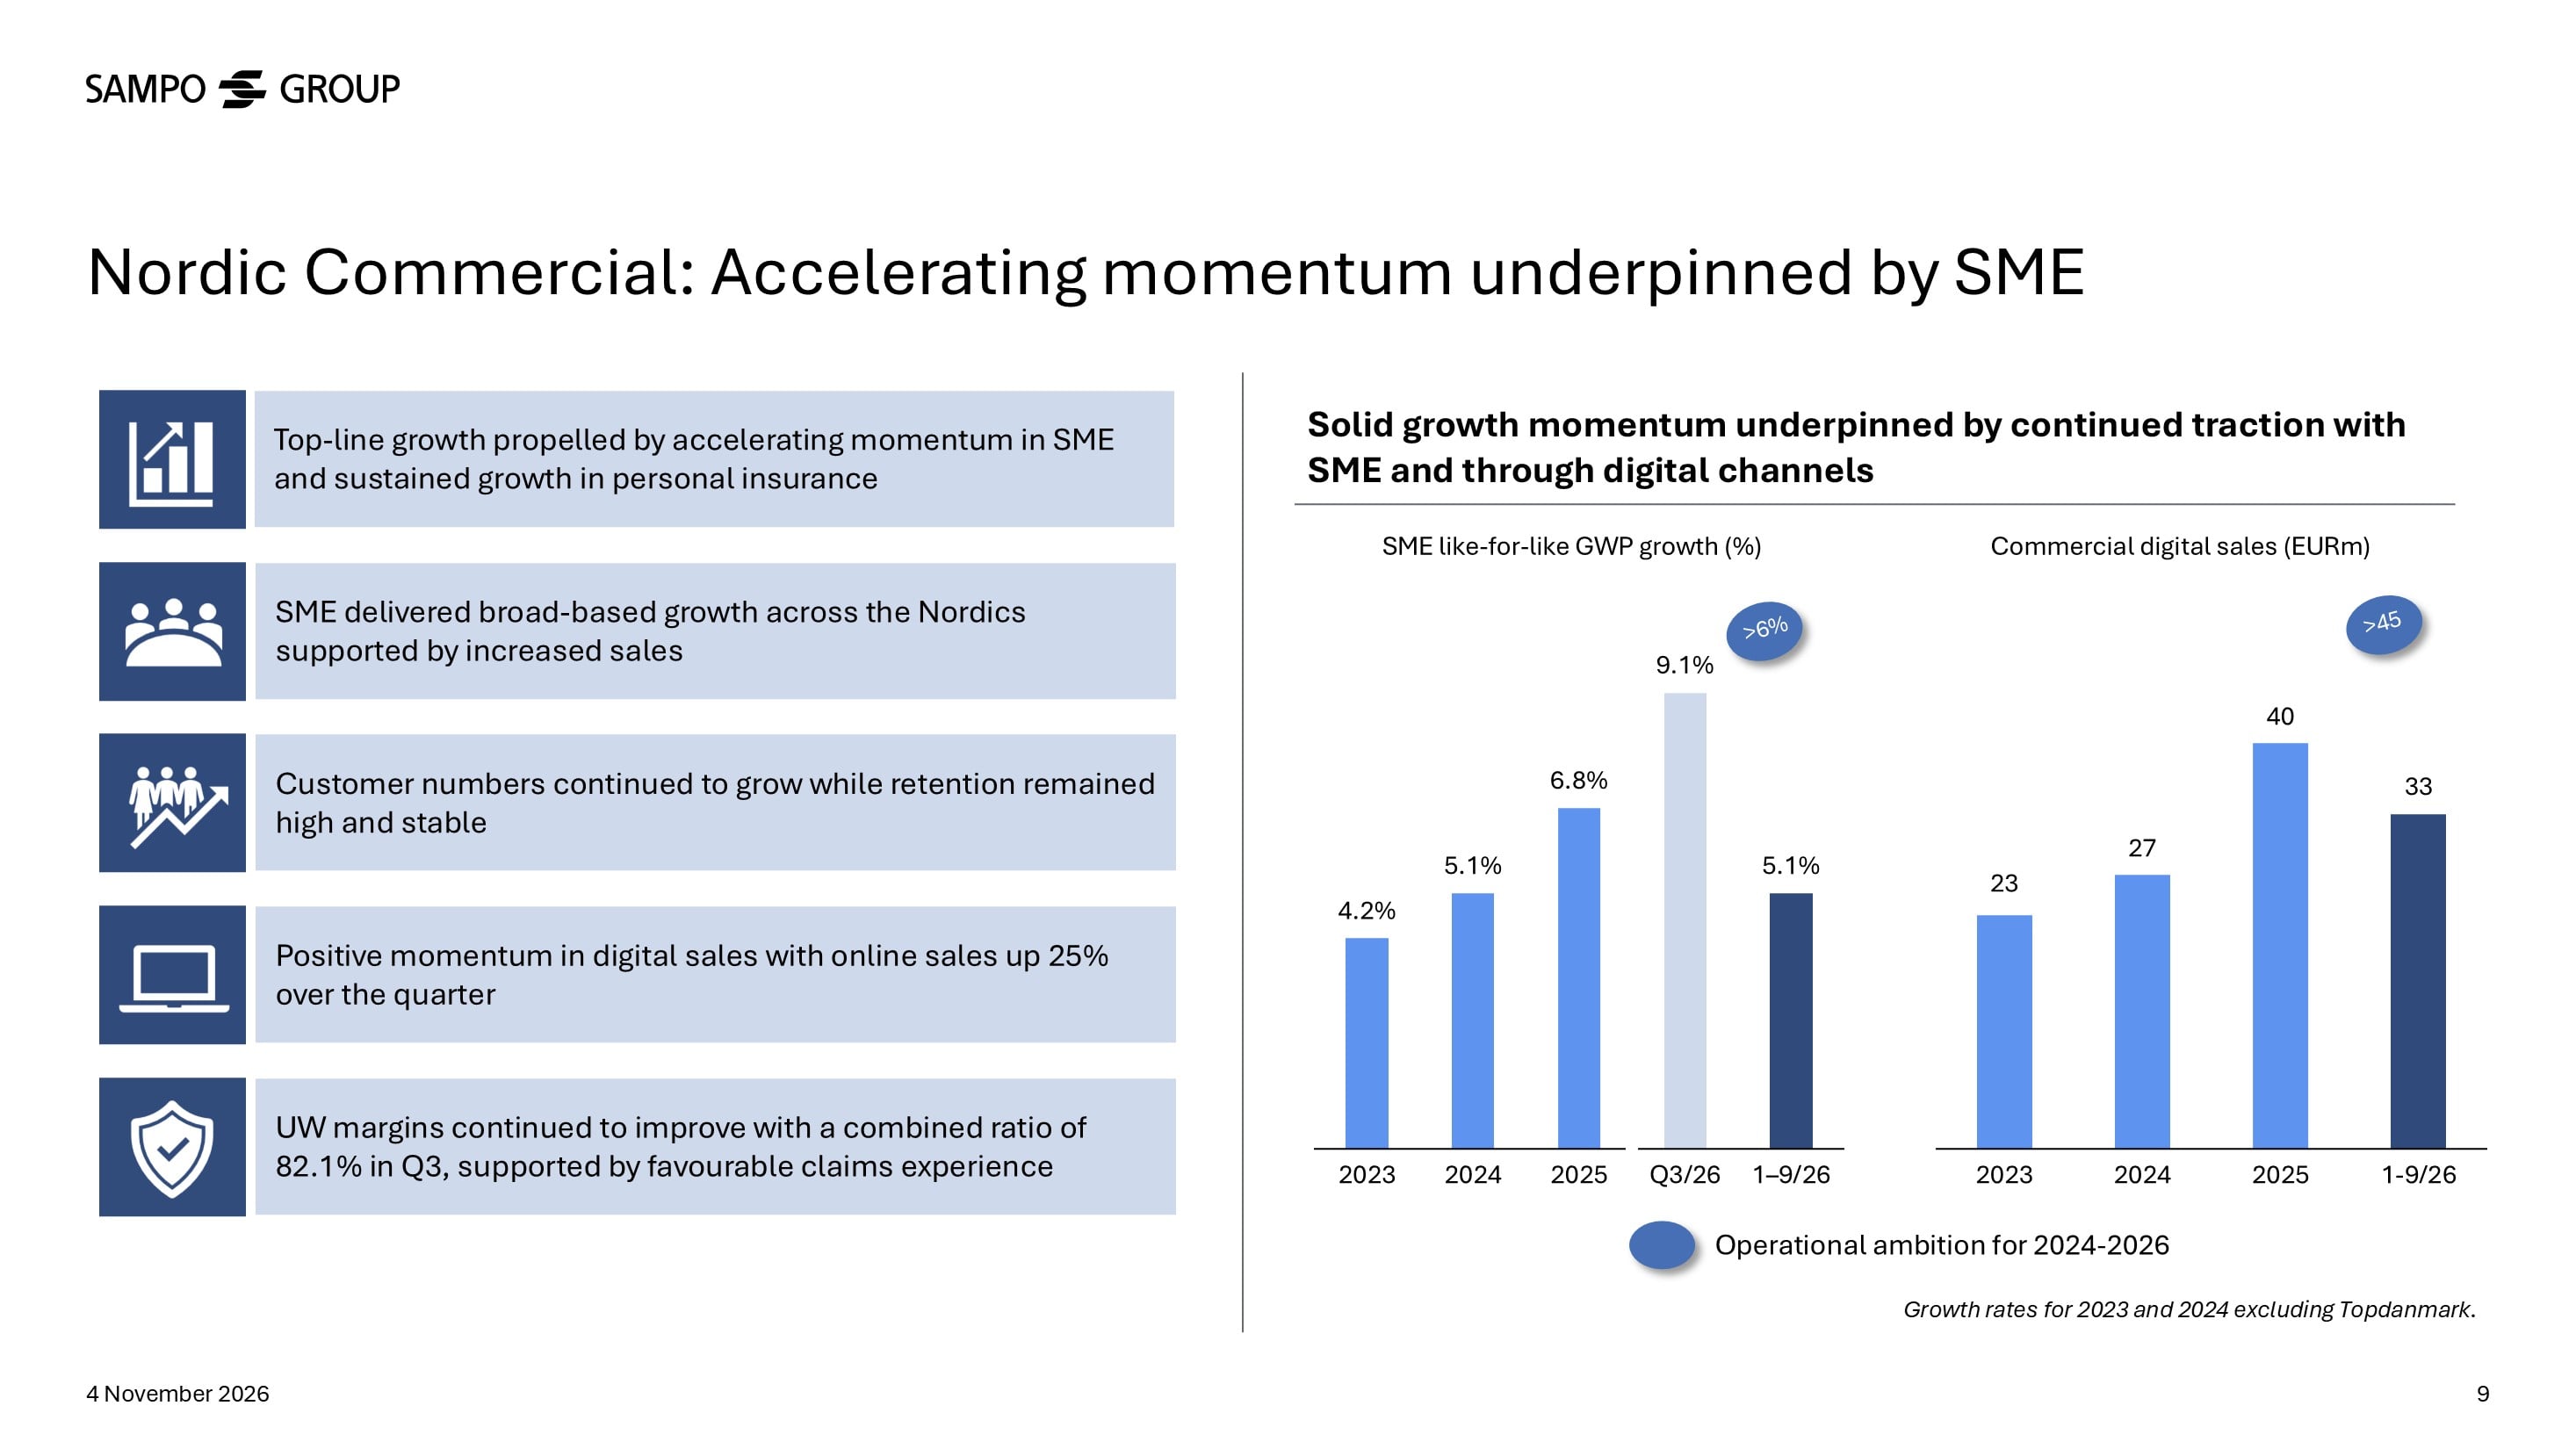
The positive momentum seen in the SME lines during the second quarter strengthened further in the third quarter with the SME portfolio growing by 9 per cent. This was supported by robust performance across all countries, particularly in Denmark, where we have seen strong growth in sales as the Topdanmark integration has progressed further, and the benefits of sales system harmonisation have continued to emerge. In total, Nordic Commercial reported almost 7 per cent like-for-like growth.
In Nordic Industrial, our focus continued to be on delivering solid margins in a softer pricing cycle in the large property segment. The segment’s like-for-like GWP increased by 3 per cent, supported by new project sales and remained momentum in personal insurance.
In addition, large claims outcomes were favourable for both segments.
What is your take on the current discussions about the potential impact of AI agents on the insurance industry?
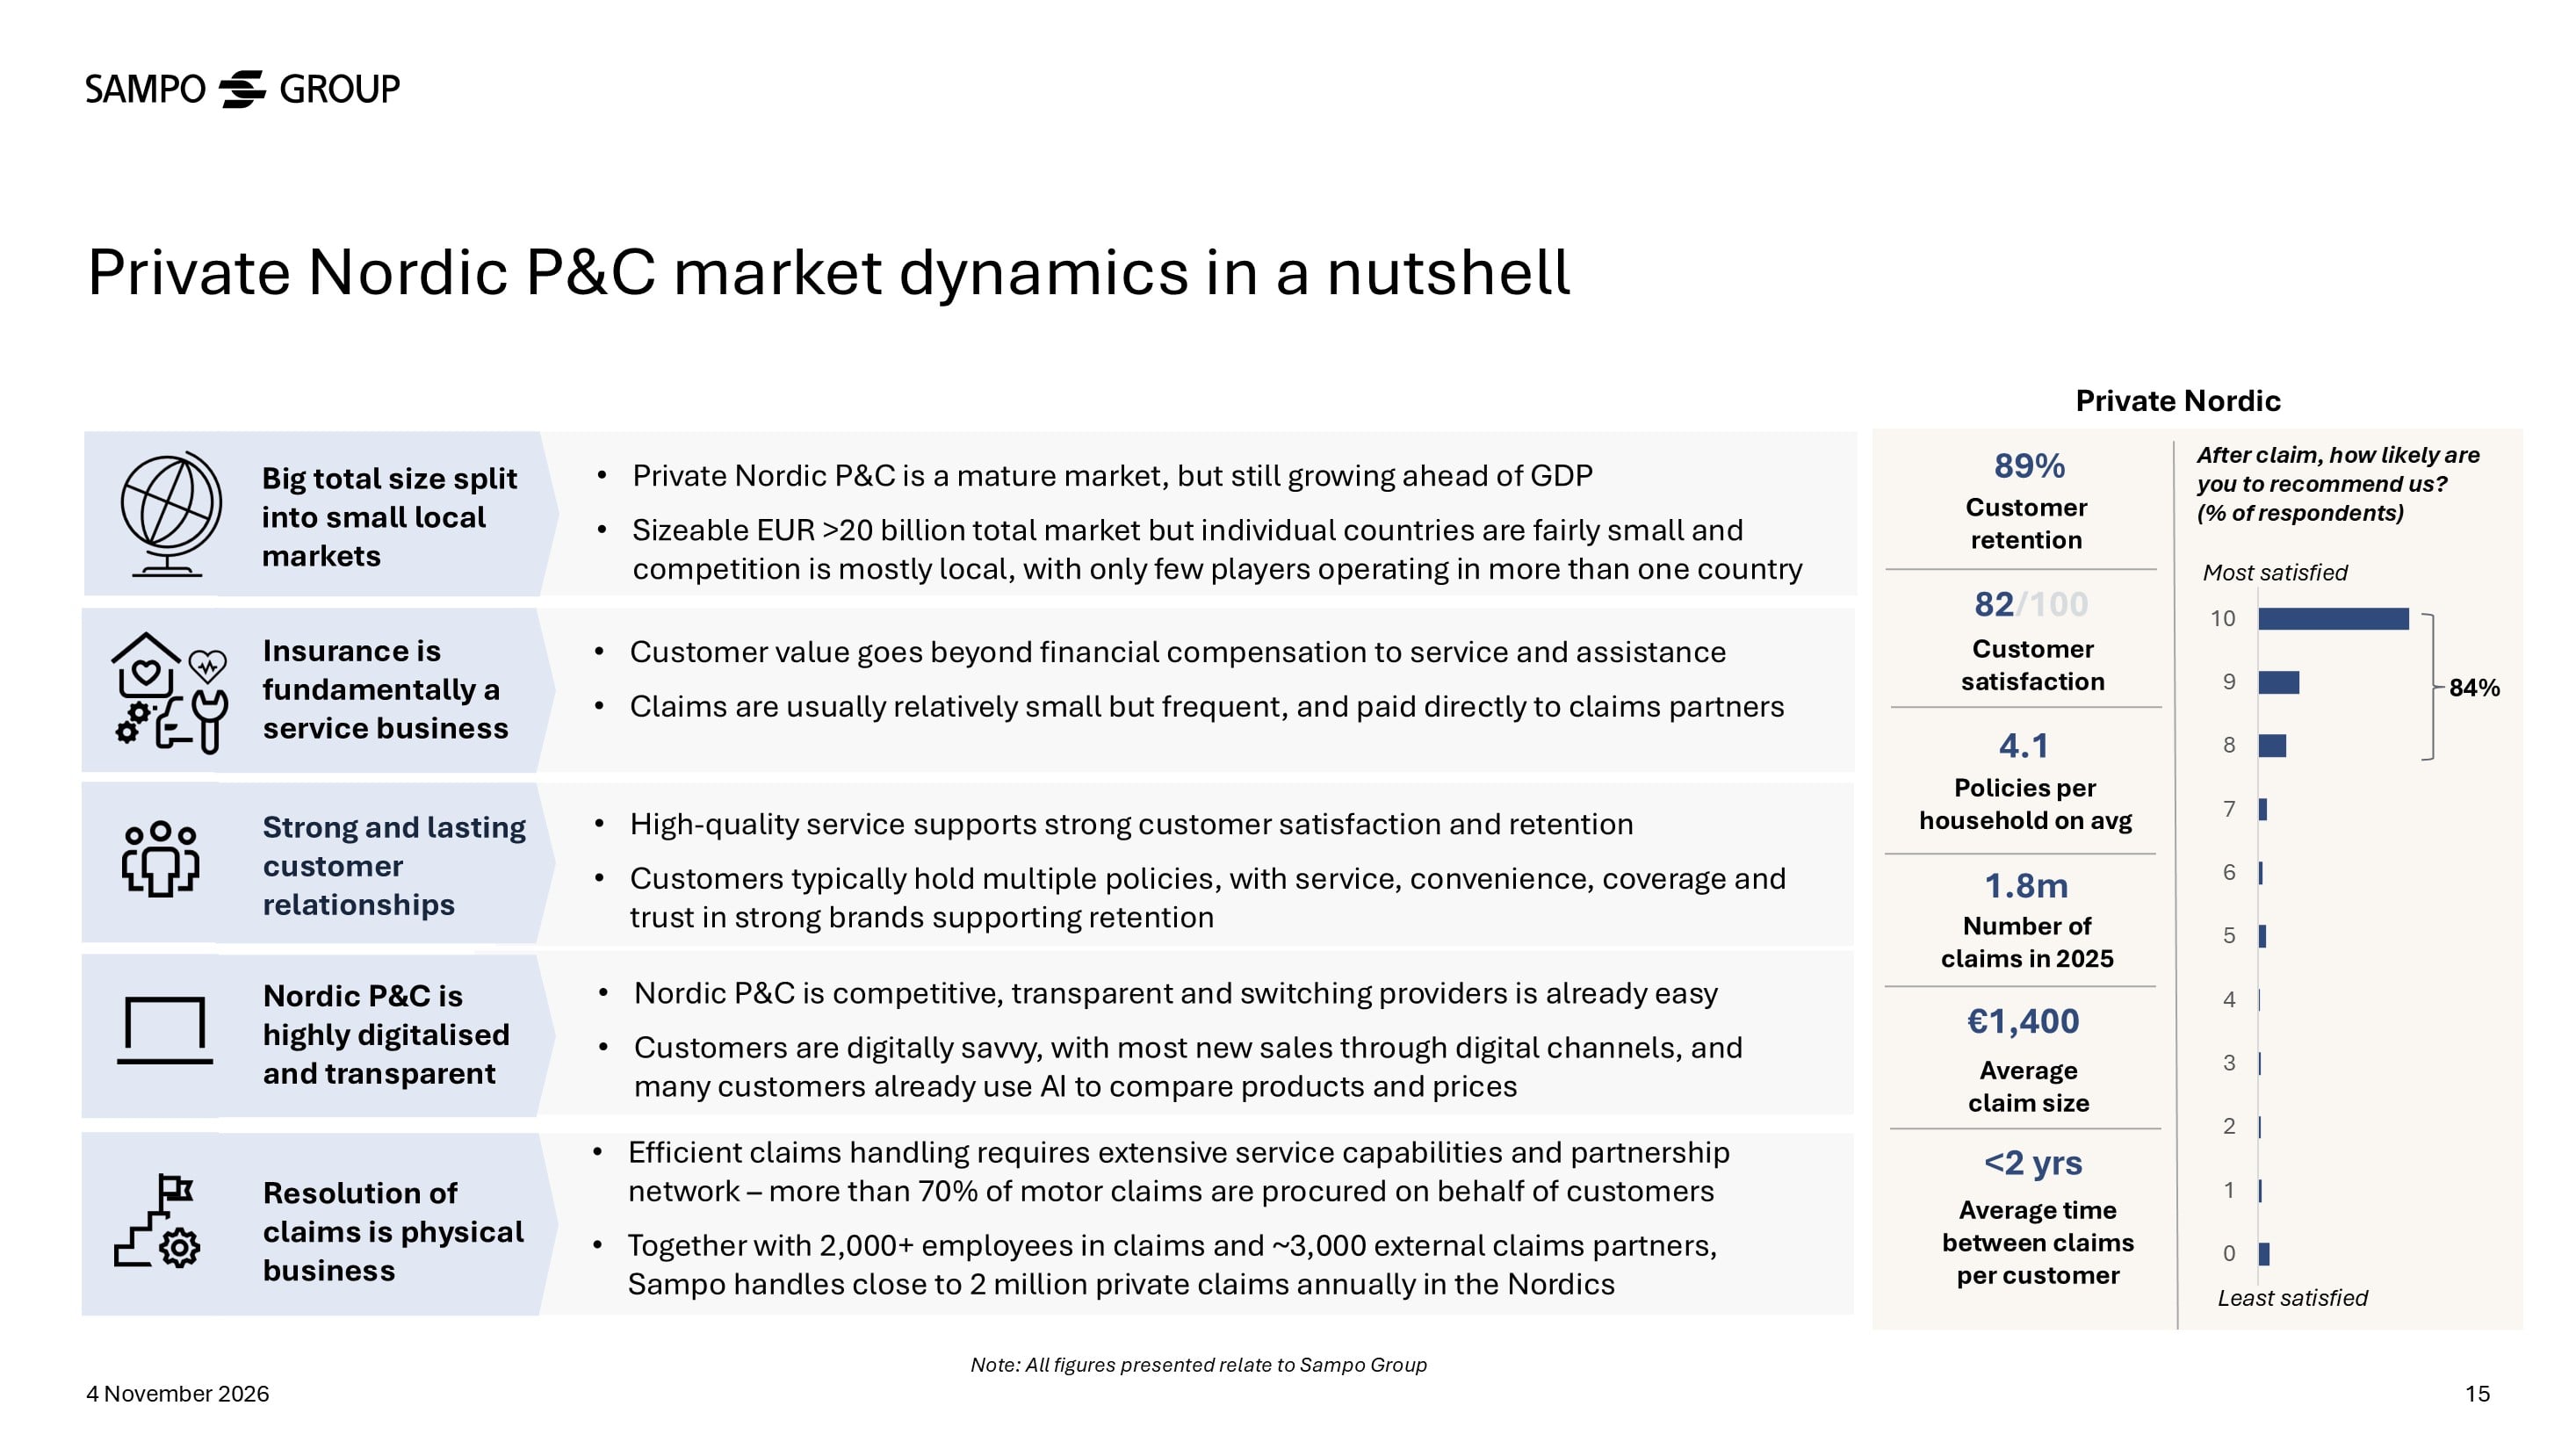
It is important to remember that insurance is much more than just selling policies. It is very much a service business, and claims handling is at the heart of it. In the Nordics alone, we have 2,000+ people working in claims and a network of around 3,000 claims partners. AI will not tow your broken-down car, repair it, or arrange a replacement for you. You still need people on the ground, local expertise, and extensive partner networks to get things done. In many cases, we do not simply pay money to the customer. We arrange for the damage to be repaired or for the problem to be fixed.
The Nordic P&C market is also quite different from many other markets. It is already highly digitalised, and comparing insurance products is relatively easy. For example, in Finland, when getting a quote for motor insurance, you typically only need to enter your car's registration number, your personal identity code, and your estimated annual mileage.
It is also worth remembering that insurers do not compete on price alone. Customers also value the quality of service, the claims experience, trust, and the convenience of having several policies with the same insurer. This is particularly relevant in the Nordics, where customer relationships tend to be long-lasting and historically retention rates have been between 85 to 90 per cent. So, while AI agents may make price comparisons and switching easier, the policy and its price are only one part of the equation.
AI agents are also most likely to work best with insurers that already have strong digital capabilities, which puts us in a good position. At the same time, AI offers us opportunities to further improve efficiency, customer service, and claims handling.
What was behind the impairment loss of Topdanmark’s IT systems?
As part of the Topdanmark integration, we have been harmonising the IT systems in Denmark, choosing the best systems from both If and Topdanmark. In Private, we are migrating to Topdanmark’s platform, while in Commercial, to If’s platform.
The impairment had no cash flow impact, and we do not expect any further impairments related to IT assets in Denmark. Overall, the Topdanmark integration has continued to progress well, and we have already achieved two-thirds of the total synergy target for 2028.
How did Sampo’s investment portfolio perform in the third quarter?
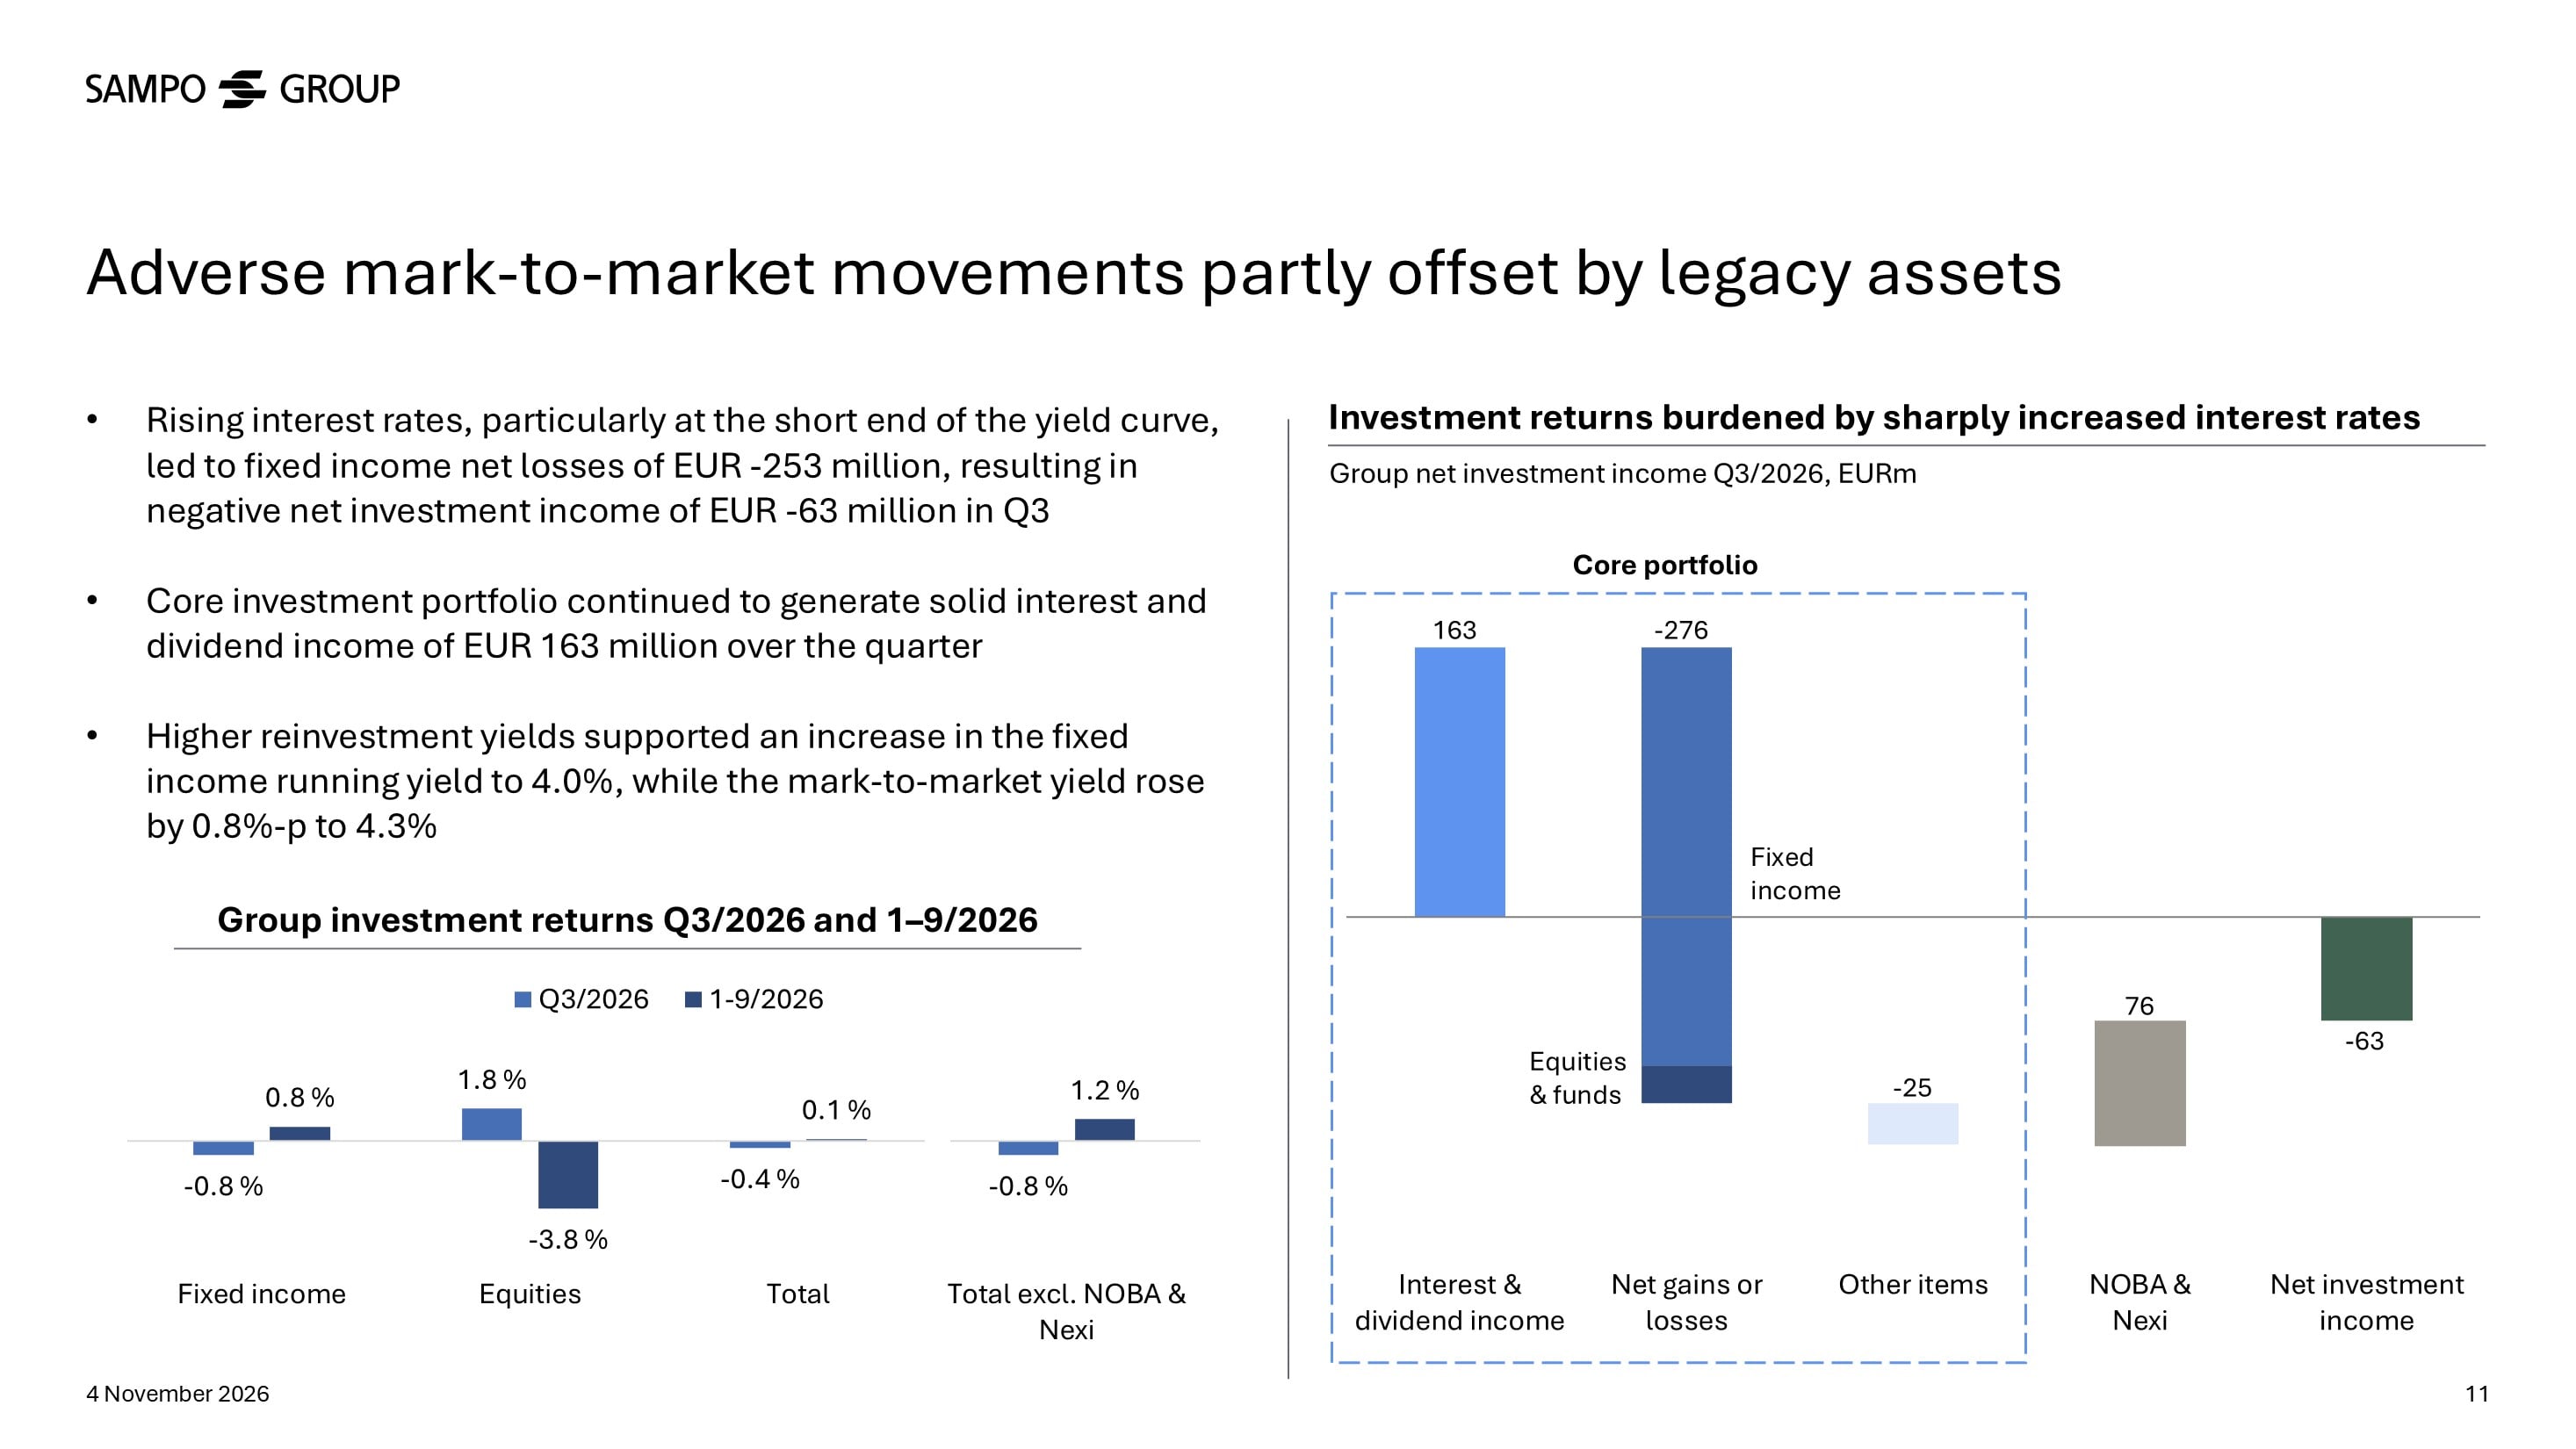
Interest rates rose quite sharply during the quarter, particularly at the short end of the yield curve, weighing materially on our investment returns. The Group’s net investment income (NII) amounted to EUR -63 million (554), driven by net losses of EUR -253 million (-15) in the fixed income portfolio, largely reflecting unrealised mark-to-market losses.
Meanwhile, the recurring interest and dividend income increased to EUR 170 million (144). Given the relatively short duration of our fixed income portfolio, we have been able to reinvest at higher yields, which should support recurring income going forward.
In total, our investment return amounted to -0.4 per cent in the quarter, reflecting -0.8 per cent return on fixed income and 1.8 per cent on equities.
We have provided more details in our quarterly Investor presentation, including our fixed income mix (slide 43) and largest direct equity holdings and investments in equity funds and ETFs (slide 44).
Your operating EPS increased by 2 per cent but reported EPS decreased by 64 per cent in in third quarter. What explains this difference?
Reported EPS came in at EUR 0.10 (0.28), weighed down by adverse short-term mark-to-market movements in the fixed income portfolio, which resulted in net investment income of EUR -63 million (554). The comparison period was boosted by a net gain of EUR 355 million from the IPO of NOBA. In addition, the EUR 118 million impairment of intangible assets related to IT systems in Denmark weighed on reported EPS.
Is there anything additional points to note?
We have announced that our Investor Update will be held on 17 November 2026 in London. We will set new targets for the next strategic period. You can follow the event live via webcast, and the materials will be available on our investor website.
