IR BLOG
January-June 2022 results - Q&A
Sampo Group continued its robust performance in the second quarter of 2022, driven by strong underwriting development.
The Group’s profit before taxes amounted to EUR 1,066 million (1,343) in the first half and EUR 499 million (710) in the second quarter. Earnings per share was EUR 1.61 (1.80) for half and EUR 0.75 (0.99) for the second quarter.
Sampo Group’s core business, P&C insurance reported an underwriting profit of EUR 679 million (658) for the first half and EUR 389 million (341) for the second quarter. The Group combined ratio was 81.1 per cent (80.7) in the first half and 78.9 per cent (80.2) in the second quarter.
With the robust results achieved in the first half of 2022. The Group is performing well ahead of its financial targets for 2021-2023.
| Key figures, EURm | 1-6/ 2022 |
1-6/ 2021 |
Change, % |
4-6/ 2022 |
4-6/ 2021 |
Change, % |
|---|---|---|---|---|---|---|
| Profit before taxes | 1,066 | 1,343 | -21 | 499 | 710 | -30 |
| If | 662 | 566 | 17 | 379 | 309 | 23 |
| Topdanmark | 60 | 208 | -71 | 23 | 71 | -68 |
| Hastings | 25 | 85 | -70 | 23 | 38 | -41 |
| Mandatum | 116 | 141 | -18 | 35 | 65 | -46 |
| Holding | 203 | 343 | -41 | 40 | 227 | -83 |
| Profit for the period | 897 | 1,112 | -19 | 414 | 586 | -29 |
| Underwriting profit | 679 | 658 | 3 | 389 | 341 | 14 |
| Change | Change | |||||
| Earnings per share, EUR | 1.61 | 1.80 | -0.19 | 0.75 | 0.99 | -0.24 |
| EPS (without eo. items), EUR *) | 1.42 | 1.64 | -0.22 | 0.61 | 0.82 | -0.21 |
| EPS (including OCI), EUR **) | -0.69 | 2.66 | -3.35 | -0.57 | 1.27 | -1.63 |
| RoE (including OCI), % | -6.7 | 25.2 | -31.9 | - | - | - |
*) Nordea-related accounting effects of EUR 103 million in January-June 2022 have been defined as extraordinary items in
accordance with Sampo Group’s dividend policy. The comparison figures included extraordinary items of EUR 93 million.
**) OCI refers to Other comprehensive income.
The figures in this report have not been audited.
Sampo Group financial targets for 2021-2023
| Target | 1-6/2022 | |
| Group |
Mid-single digit UW profit growth annually on average (excluding COVID-19 effects) |
3% (17% excluding reported COVID-19 effects in H1/2021) |
| Group combined ratio: below 86% | 81.1% | |
| Solvency ratio: 170-190% | 245% (233% including dividend accrual) | |
| Financial leverage: below 30% | 29.2% | |
| If | Combined ratio: below 85% | 78.9% |
| Hastings |
Operating ratio: below 88% | 88.6% |
| Loss ratio: below 76% | 75.4% |
Financial targets for 2021-2023 announced at the Capital Markets Day on 24 February 2021.
Sampo Group’s underwriting profit for the second quarter increased by 14 per cent. What were the drivers behind the strong growth?
The underwriting profit growth was driven by the continued strong performance in our Nordic P&C operations.
If’s underwriting profit increased by 26 percent in the second quarter, supported by strong premium growth and continued robust underlying development in a competitive but disciplined operating environment. In addition, If benefitted from higher discount rates. Meanwhile, Topdanmark reported stable but solid underwriting results.
The UK motor insurance market has remained challenging with competitive pricing and elevated claims inflation. Despite the challenging environment, Hastings was able to report resilient underwriting results supported by disciplined pricing and its agile business model.
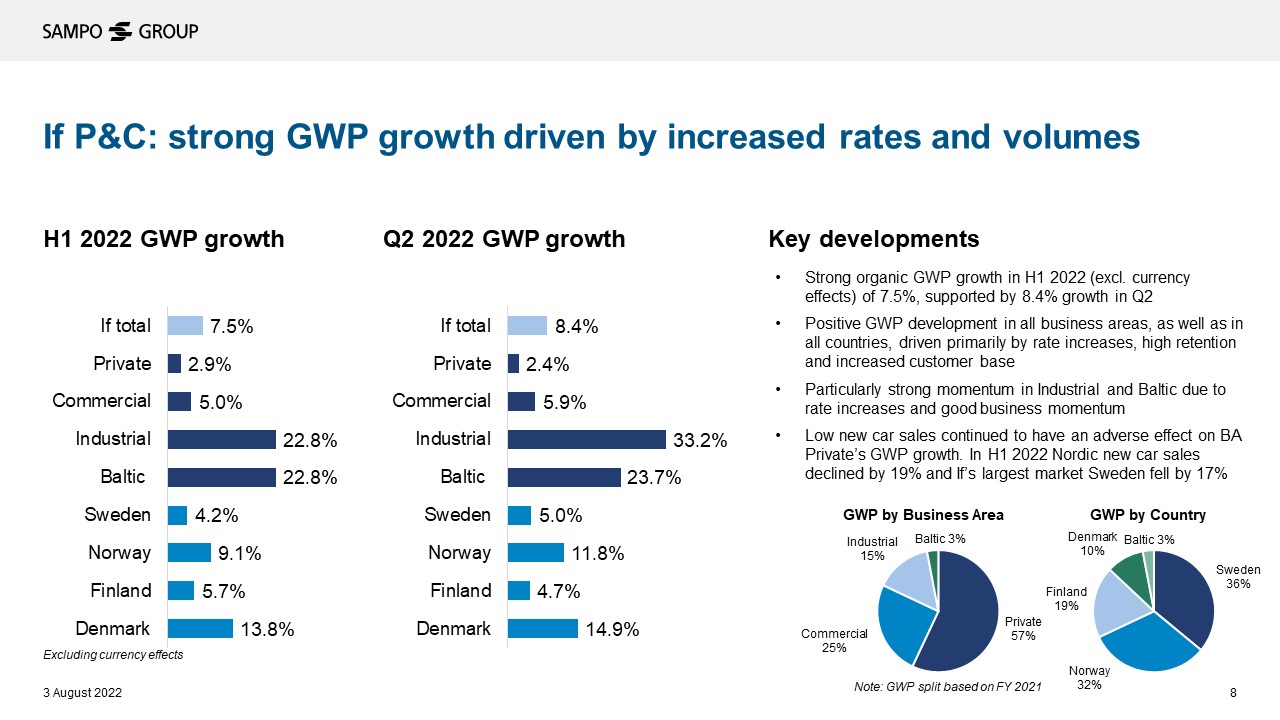
If’s currency adjusted gross written premiums (GWP) growth accelerated to 8.4 per cent in the second quarter from 6.9 per cent in the first quarter. What were the biggest growth drivers?
If’s premiums grew across all markets and Business Areas, supported by continued strong renewals, high retention and price adjustments. The strongest growth was reported by the Business Area Industrial, which achieved 33.2 per cent year-on-year in the second quarter. The conditions in the Nordic Industrial market are currently compelling following a withdrawal of capacity by some competitors, which has allowed us to increase rates to attractive levels over recent years.
In addition to BA Industrial, If’s Baltic operations reported particularly strong GWP growth of 23.7 per cent. Growth was very strong in all three Baltic countries with continued rate increases, high retention and growing customer base.
If’s largest Business Area, Private, saw GWP growth of 2.4 per cent in the second quarter, supported by rate increases, a growing customer base and high retention. However, the growth was negatively affected by the weak new car sales in the Nordics and especially in Sweden, which is the largest market for If. Excluding the Swedish mobility business, the GWP growth for BA Private was 5.3 per cent in the second quarter.
Picture from Investor presentation
How did the claims inflation develop in Sampo’s core markets?
In the Nordics, claims inflation has ticked up from 3-4 per cent at the end of the first quarter to just above 4 per cent, in line with expectations. This has successfully been covered with rate increases and we continue to monitor claims trends carefully and react with further price adjustments if needed.
In the UK motor insurance market wide pricing has continued to lag claims inflation, which has now increased to 10-12 per cent. Hastings has been disciplined in its pricing and protected its margins with price increases ahead of the market, leading to lower motor volumes.
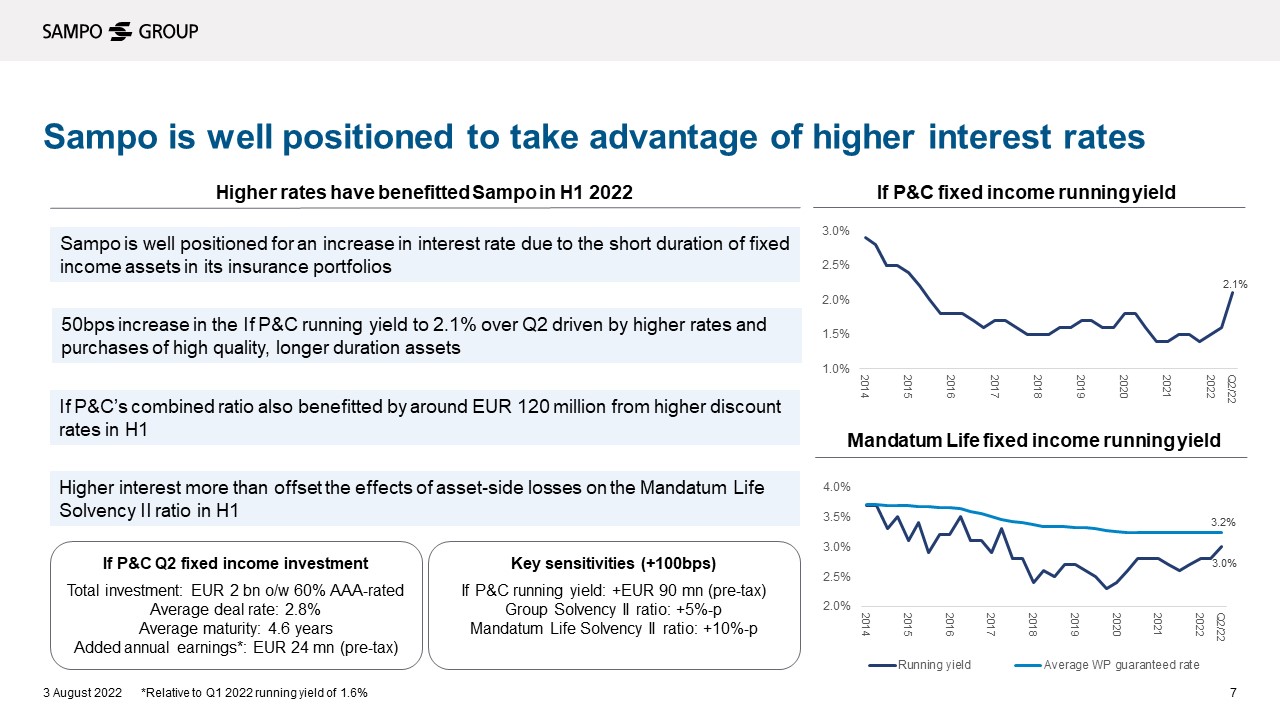
How have Sampo benefitted from higher interest rates?
On the asset side, Sampo has been well positioned due to the short duration of fixed income assets in the insurance portfolios. This has enabled the fast rotation into higher yielding instruments. For example, during the second quarter, If invested EUR 2 billion into high quality assets with longer duration, leading to added annual pre-tax earnings of EUR 24 million (relative to the Q1 running yield). In aggregate, If’s running yield increased to 2.1 per cent from 1.6 per cent at the end of the first quarter. On the liability side, If benefitted by around EUR 120 million from higher discount rates in the first half of 2022.
For Mandatum, higher interest rates improve the profitability of the with-profit portfolio, which is in a run-off stage. Mandatum Life’s fixed income running yield increased to 3.0 per cent at the end of second quarter, the highest since 2017 and approaching the average with-profit guaranteed rate of 3.2.
Picture from Investor presentation
Sampo Group’s Solvency II ratio was exceptionally high, 245 per cent or 233 per cent including the dividend accrual at the end of June 2022. What explains the high solvency coverage?
The three main drivers behind the 41 percentage points increase from the first quarter (204) were the robust underwriting performance, the Nordea-exit and favourable market effects such as higher interest rates. The Nordea-exit had positive effect of 29 percentage points, which was partially offset by launch of the 1 billion buyback programme (-19 percentage points). The Groups’ operating performance had positive effect of 6 percentage points, while market items had a positive effect of 16 percentage points, including 7 percentage points from higher interest rates and another 7 percentage points from lower symmetric adjustment.
Sampo Group’s financial leverage increased to 29.2 per cent from 24.8 per cent at the end of the first quarter. What explains the increase?
The increase was driven by the payment of the annual dividend in May, executed share buybacks and adverse asset value development taken through other comprehensive income. Adjusting for the EUR 1 billion buyback programme and planned EUR 800 million debt reduction in the future, the financial leverage was 26.8 per cent.
Sampo completed the Nordea-exit in April 2022. When will the other financial investments be divested?
We expect to exit the other investments to over the next 2-3 years, as these assets naturally mature. However, as a co-investor, we are not fully in control over this schedule, which will also depend on the prevailing market environment.
Sampo has repurchased its own shares under three buyback programmes since October 2021. How does this benefit Sampo’s shareholders?
Many Sampo shareholders prefer to receive capital returns via buybacks; hence, Sampo has chosen to use both dividends and buybacks to return excess capital. Buybacks also provide flexibility, as they enable shareholders to choose between receiving cash returns by selling shares while maintaining their ownership share in the Group, or increasing of their stake in the company by holding on to the stock.
Between the start of the first buyback programme in October 2021 and the end of July 2022, Sampo has returned almost EUR 1.2 billion of excess capital to shareholders via buybacks. In total, 27.1 million shares have been repurchased, corresponding to 4.9 per cent of all shares prior to the start of the first programme. This has led to an EPS accretion of 5.1 per cent.
The ongoing buyback programme of EUR 1 billion (EUR 793 million remaining at the end of July 2022) will end by 8 February 2022. As announced on 9 June 2022, Sampo’s management intends to propose to the Board a second distribution of capital in the form of buybacks or extra dividend, or a combination thereof, in connection with the publication of the 2022 financial result in February 2023.
Sampo’s Investor Update 2022
Sampo will hold an investor update event on Thursday 8 September 2022 in London. The event will be a deep dive into key operational initiatives that underpin Sampo Group’s financial targets, with presentations from management and Q&A.
The presentations will start at 13:00 pm (UK time). The agenda will be later available at www.sampo.com. The event will be webcast and can be followed live at the same address.
For further information, please contact Sampo’s IR Team by email: ir@sampo.fi
